Analytics
Monitor API call volume, cost, request latency, and error rates — filtered by model, API key, tags, and time range.
The Analytics page is the operational dashboard for your Kimchi traffic. It tracks cost, request volume, latency, and error rates across all models and providers — with filtering by model, API key, team, tags, and time range.
This page is designed for platform engineers who need to monitor API health and for team leads who want to understand cost and reliability at the model level.
Filters
A filter bar at the top of the page lets you narrow down the data:
| Filter | What it does |
|---|---|
| Models | Select one or more models to isolate. Shows a count badge (e.g., "All models 29"). |
| API keys | Filter to requests made with specific API keys. |
| Teams | Select one or more teams to see only their usage. |
| Tags | Filter by tags attached to requests. Combine multiple tags for fine-grained views. |
| Time range | 24h, 7d, 14d, 30d, or Custom. |
| Timezone | Controls how daily boundaries are drawn in charts. |
Live Mode
Toggle Live Mode to auto-refresh the page as new data arrives. Useful when monitoring a deployment or load test in real time.
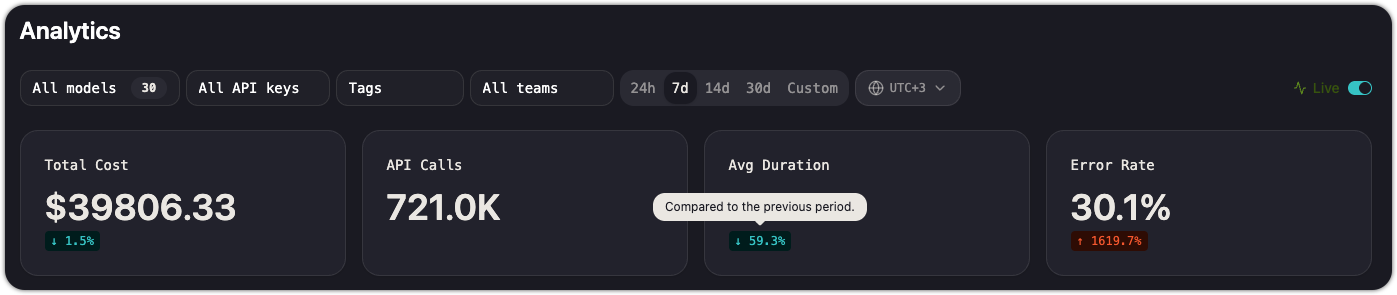
KPI cards
Four summary cards at the top provide an at-a-glance status:
| Card | What it shows | Trend indicator |
|---|---|---|
| Total Cost | Aggregate spend for the filtered view | Change vs. previous period (e.g., "11.5% decrease") |
| API Calls | Total number of requests | — |
| Avg Duration | Mean request latency across all calls | Change vs. the previous period |
| Error Rate | Percentage of requests that returned an error | Change vs. the previous period |
Trend indicators compare the selected time range against the immediately preceding period of the same length. A 7d view compares this week to last week.
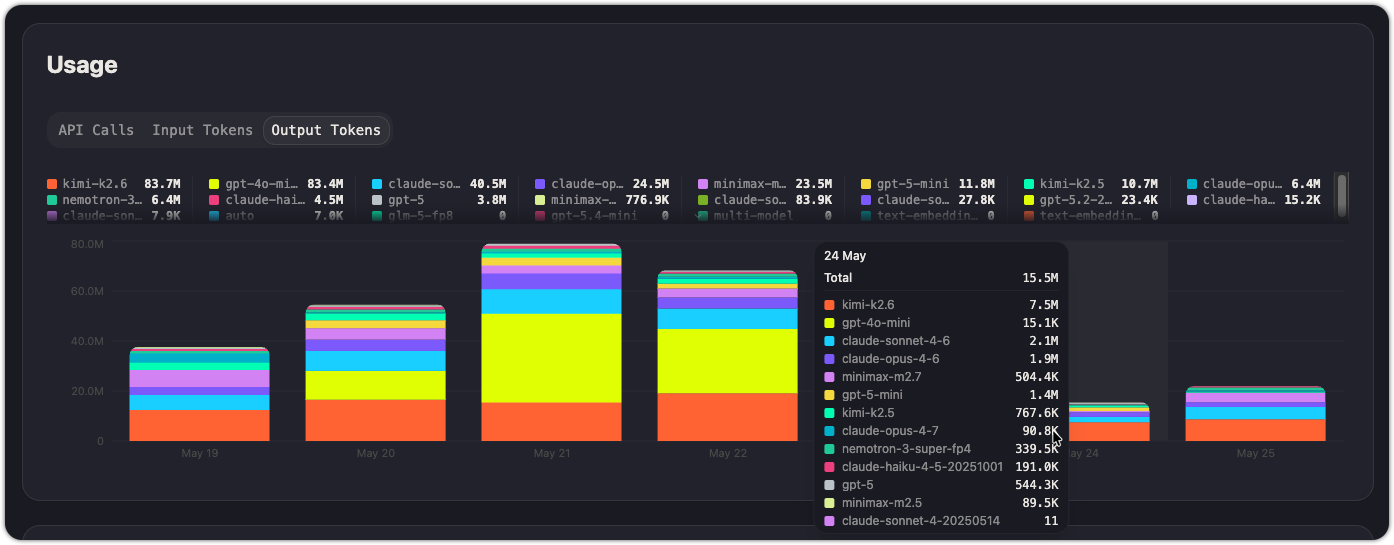
Usage
The Usage section shows request volume and token consumption over time, broken down by model. Three tabs let you switch the metric:
- API Calls — stacked bar chart showing call count per model per day
- Input Tokens — stacked bar chart showing input token volume per model per day
- Output Tokens — stacked bar chart showing output token volume per model per day
Each model gets its own color in the legend. Hover over any bar segment to see the exact count. The legend also shows totals for each model across the full time range.
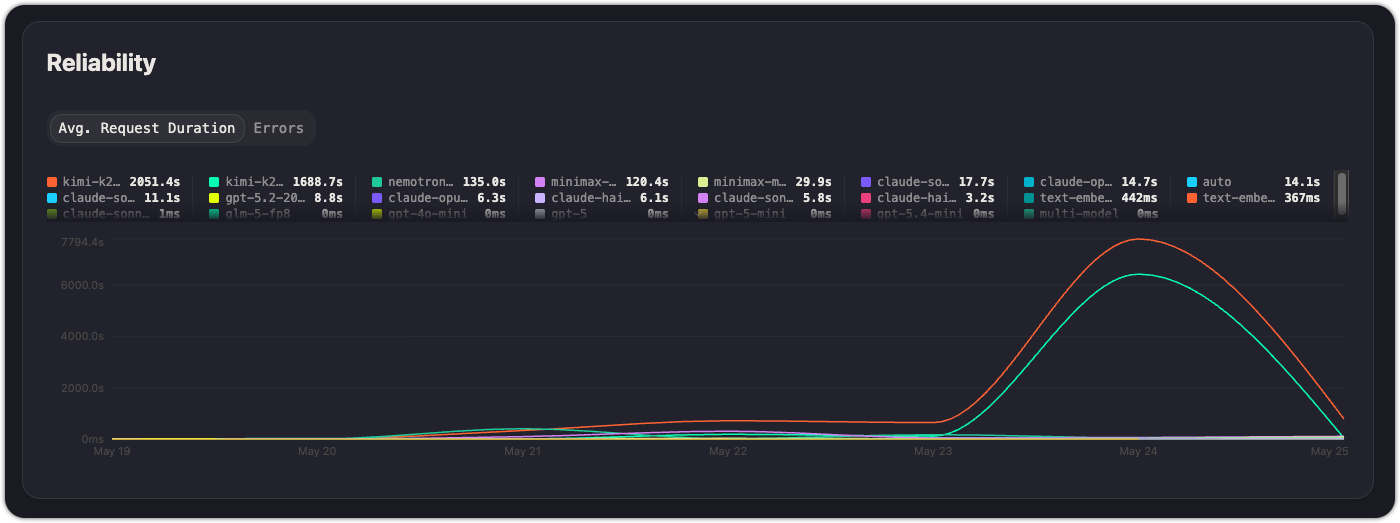
Reliability
The Reliability section tracks how your API calls are performing:
Avg. request duration
A time-series chart showing average request latency per model. Each model is a separate line. Use this to:
- Identify models with consistently high latency
- Spot latency regressions after a deployment or model update
- Compare latency across providers serving the same model
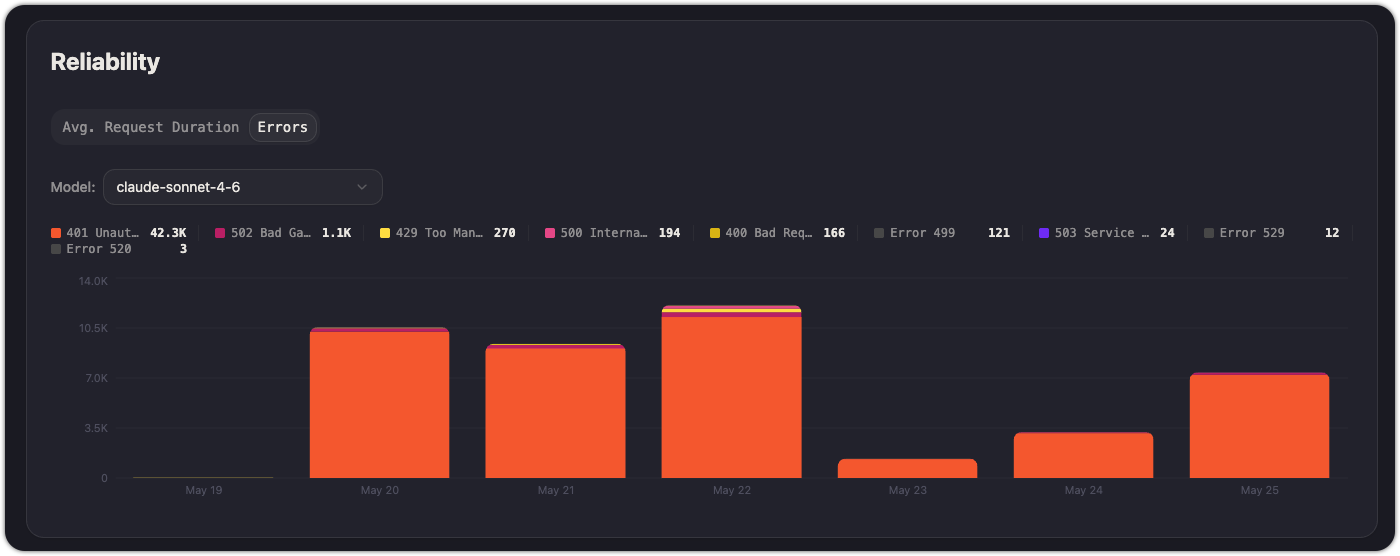
Errors
Switch to the Errors tab to see error volume over time. Correlate error spikes with specific models, deployments, or traffic changes.
A sustained error rate above your baseline may indicate a provider outage, a misconfigured API key, or rate limiting. Check rate limits if you see throttling-related errors.
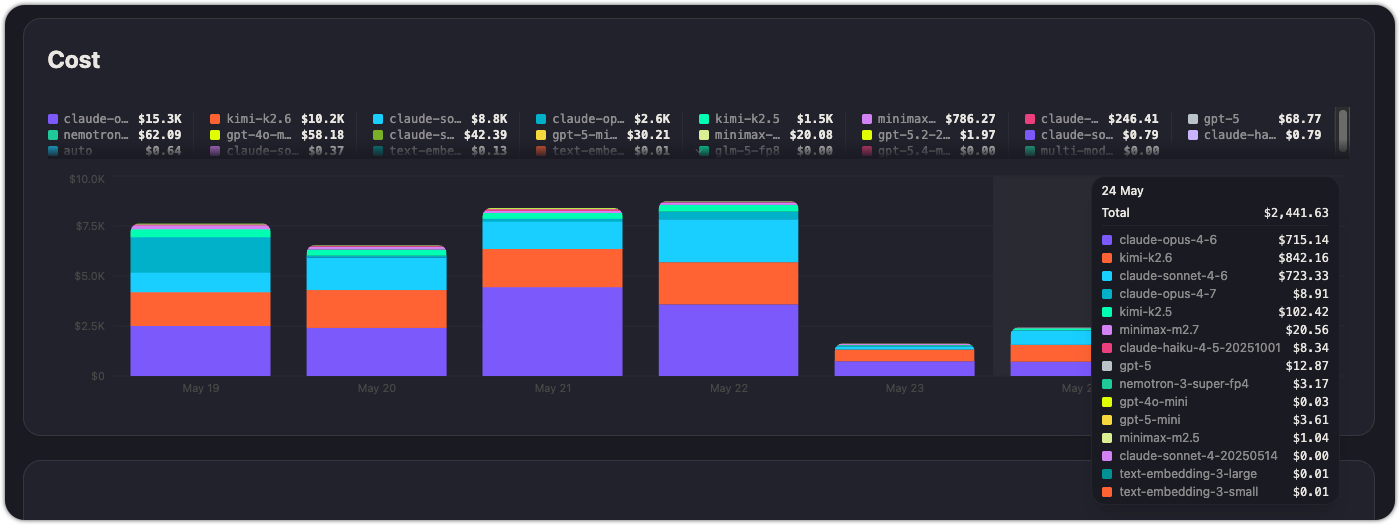
Cost
A stacked bar chart showing daily cost broken down by model. Each model's contribution is visible, so you can quickly identify which models drive the most spend on any given day.
The legend shows cumulative cost per model over the full time range, making it easy to rank models by expense without needing a separate table.
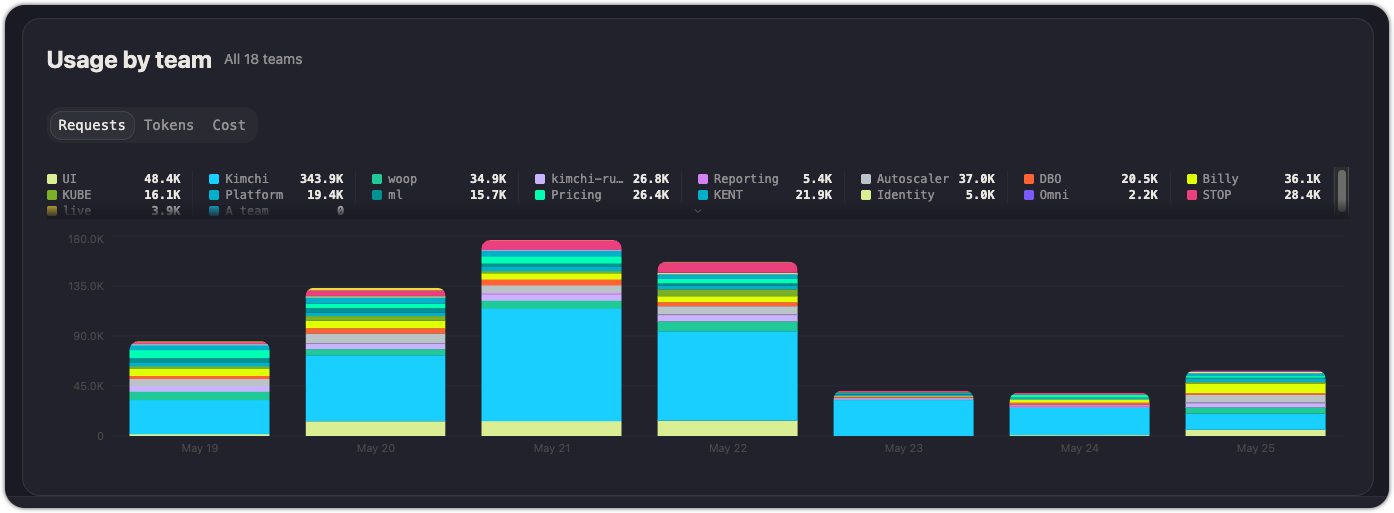
Usage by team
A section at the bottom breaks down usage metrics by team. This connects the operational data (models, latency, errors) with the organizational structure (teams). Use it to see which teams are responsible for the most traffic, the highest error rates, or the most expensive model choices.
Practical uses
- Monitor API health: check Avg Duration and Error Rate daily. A rising error rate or latency spike may need immediate attention.
- Identify costly models: sort the Cost chart legend to find the most expensive models. Evaluate whether the cost is justified by the use case, or whether traffic should be shifted to a cheaper model.
- Debug with tags: if you've tagged requests by environment (
env:prod,env:staging) or feature (feature:onboarding), use the Tags filter to isolate traffic for a specific deployment or feature. This narrows down where errors or cost spikes originate. - Capacity planning: use the API Calls trend over a 30d window to forecast future request volume and assess whether you'll need higher rate limits.
See also
Updated about 2 months ago