Overview
An overview of the Kimchi console's reporting pages — adoption, usage, analytics, teams, and budgets.
The Kimchi console gives you a centralized view of how your organization uses AI models — who's making requests, what it costs, where the spend is going, and whether you're staying within budget. These reporting pages are designed for team leads, engineering managers, and anyone responsible for AI adoption and cost management.
What data feeds into reporting
Two types of activity appear in the console:
- API requests — every request sent through the Kimchi Inference API (
llm.kimchi.dev) is tracked automatically. No setup required. Token counts, model usage, latency, and cost are recorded for each call. - (Coming soon!) Coding tool telemetry — usage from AI coding tools like Claude Code and OpenCode requires OpenTelemetry (OTel) configuration. Once configured, session-level metrics (tokens, cost, tool calls) flow into the console alongside API data. See Report coding tool metrics to Kimchi for setup instructions.
Pages
The console organizes these across six pages, each serving a different question:
| Page | What it answers | Primary audience |
|---|---|---|
| Adoption report | Is AI usage growing? Where is the spend going? | Engineering leadership, finance |
| Usage | Who is using what, and how much does it cost? | Team leads, engineering managers |
| Productivity | Are coding tools producing sessions, PRs, and code output? | Engineering managers, team leads |
| Analytics | How are our API calls performing? Are there errors or latency issues? | Platform engineers, team leads |
| Teams | How are users organized, and who belongs to which team? | Org admins, team leads |
| Budgets | Are we staying within spending limits? | Finance, engineering managers |
Adoption report
The Adoption report tracks organization-wide trends: active user count, total cost, request volume, and how those numbers evolve over time. It breaks down spend and usage by provider and by harness (Kimchi, Claude Code, OpenCode), and ranks models by cost. Use it to justify AI investment, spot adoption plateaus, or identify which tools and models drive the most value.
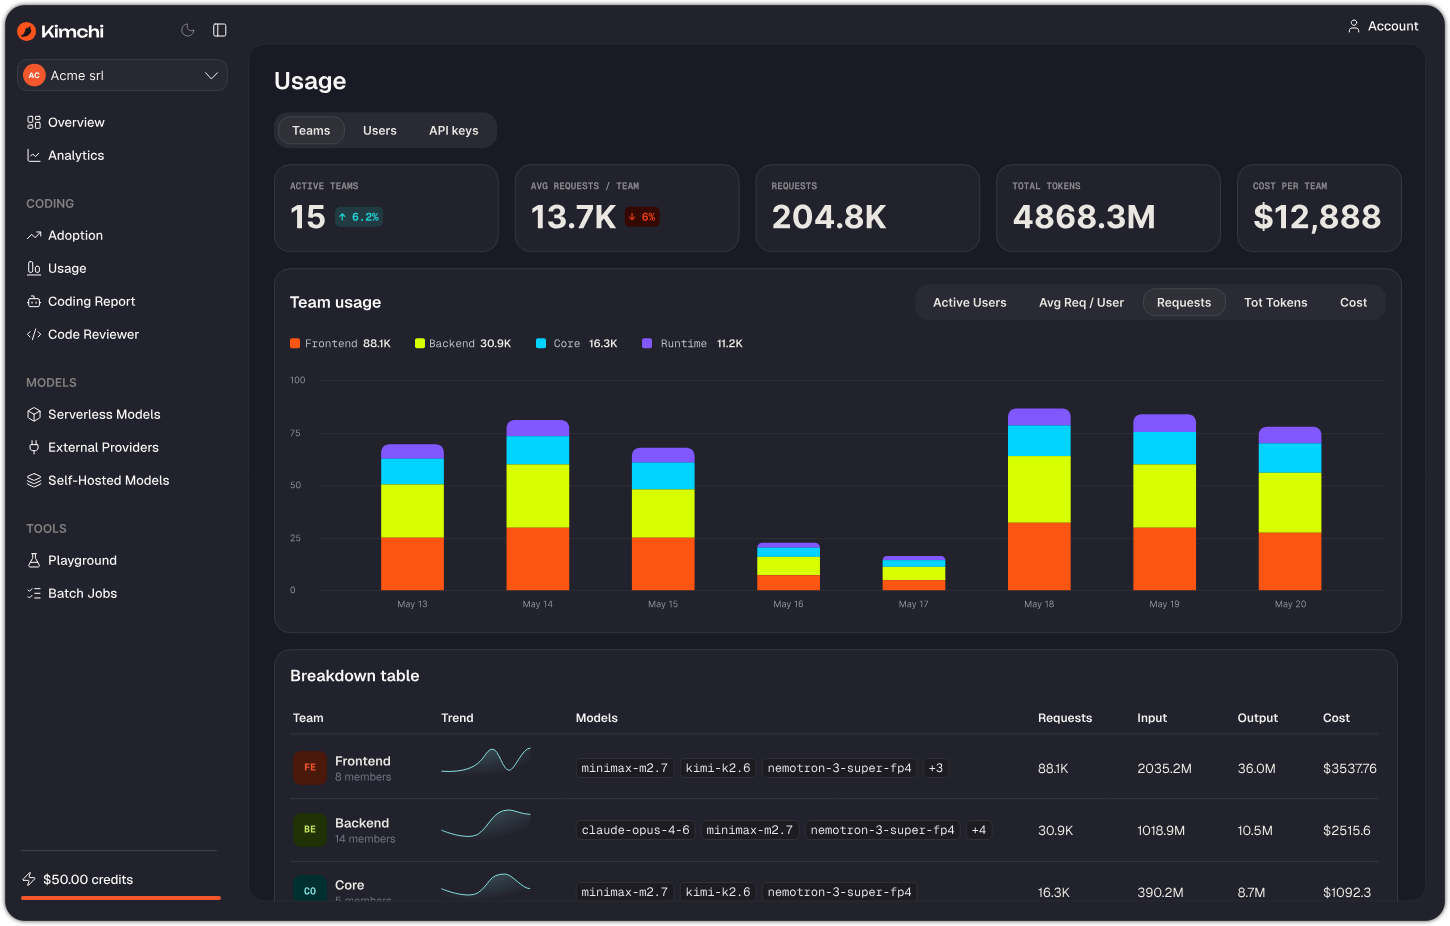
Usage
The Usage page shows who is consuming what. Switch between a by team view and a by user view. The team view shows aggregated metrics per team — requests, tokens, cost, and which models each team favors. The user view drills into individual developers, showing their team affiliation, model preferences, and personal cost footprint. Live Mode keeps the data current as requests flow in.
Productivity
The Productivity page measures software delivery output from AI-assisted coding. It tracks agent sessions over time, pull requests and commits created, and lines of code added and removed. Use it alongside Usage to understand whether coding tool consumption is translating into developer throughput.
Analytics
The Analytics page is the operational dashboard. It tracks total cost, API call volume, average request duration, and error rate — with trend indicators showing whether each metric is improving or degrading. Dig into usage by model, reliability metrics, and cost breakdowns. Filter by model, API key, tags, and time range. Use it to catch latency regressions, identify expensive models, and correlate errors with deployments.
Teams
The Teams page lets you organize users into named groups. Teams can be created manually or attributed automatically based on how users are provisioned. Team membership flows into Usage and Analytics filtering — once users belong to teams, you can slice all reporting data by team.
Budgets
The Budgets page lets you set spending limits at multiple levels — organization-wide per-user caps (hard and soft), per-API-key limits, and per-team limits (pooled or per-user). Each budget tracks total spend against its limit with a progress bar and status indicator. Use budgets to control costs from org-wide guardrails down to individual developer allowances.
Related resources
Updated about 1 month ago